

Part of Lab: RUN_002.
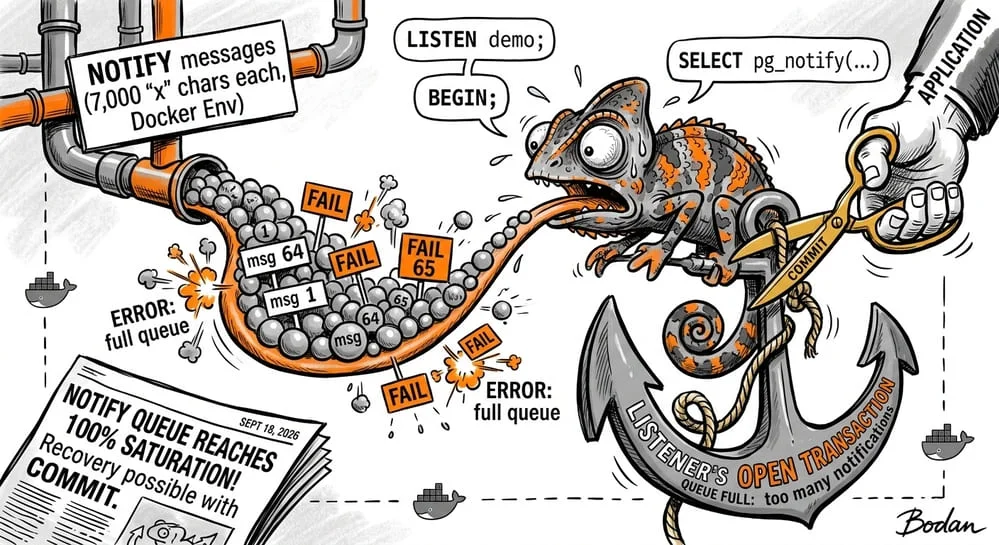
What does the PostgreSQL error too many notifications in the NOTIFY queue mean? It means the notification queue is full. One way to trigger this condition is to leave a transaction open on a connection that has executed LISTEN: notifications accumulate until new sends start failing.
Some database behaviors are easier to understand when you watch them fail. The LISTEN/NOTIFY queue is one of them. In this article, we reproduce the problem with Docker, measure occupancy using pg_notification_queue_usage(), and verify recovery after a COMMIT.
We ran a small experiment with PostgreSQL 17.11. The result was clear: the queue reached 100%, new sends failed, and ending the listener's transaction brought queue usage back to zero. We then successfully sent and received another notification.
This article documents that experiment, performed on September 18, 2026.
How LISTEN/NOTIFY Works in PostgreSQL#
LISTEN registers a connection to receive notifications on a channel. NOTIFY, or its function equivalent pg_notify(), publishes a message to that channel. This is PostgreSQL's native asynchronous notification mechanism: one process can tell another that something changed without the receiver repeatedly querying a table to discover the change.
Transactions are part of this mechanism. A notification is published when the sending transaction commits, and a listener inside a transaction waits until that transaction ends before receiving it. This relationship between notifications and transactions is central to the experiment, as explained in the LISTEN/NOTIFY documentation.
Set Up PostgreSQL 17 with Docker and a 512 KiB Queue#
To reproduce the experiment, you need Docker with Compose and two terminals. Create a directory and save the following configuration as compose.yaml:
services:
  postgres:
    image: postgres:17
    environment:
      POSTGRES_PASSWORD: laboratorio
    command: [postgres, -c, max_notify_queue_pages=64]
    healthcheck:
      test: [CMD-SHELL, "pg_isready -U postgres"]
      interval: 1s
      timeout: 3s
      retries: 30
The container does not publish any ports. We connect through docker compose exec, using the psql client included in the image.
These are the values we queried directly from the server:
| Setting | Observed value | | --- | --- | | Version | PostgreSQL 17.11, Debian, 64-bit | | Page size (block_size) | 8,192 bytes | | Queue limit (max_notify_queue_pages) | 64 pages | | Configured capacity | 524,288 bytes, or 512 KiB | | Initial queue usage | 0 |
PostgreSQL 17 allows this limit to be configured at startup. The default remains 1,048,576 pages, which equals 8 GiB with 8 KiB pages. For this experiment, we reduced it to 64 pages using -c max_notify_queue_pages=64. This lets us observe saturation with very few messages. The setting is described in the official parameter documentation.
From the directory containing the file, start PostgreSQL:
docker compose -p notify-sql-report up -d --wait --wait-timeout 120Wait until the container is healthy before continuing. If initialization takes longer and the container is marked unhealthy, check docker compose -p notify-sql-report logs postgres. During our run, initialization completed after the first health wait had expired; running the startup command again allowed us to proceed.
Step 1: Keep the Listener Inside an Open Transaction#
Open a connection in terminal A:
docker compose -p notify-sql-report exec postgres psql -X -U postgres -P pager=offIn this first session, execute these statements separately:
SET application_name = 'listener_informe';
LISTEN demo;
BEGIN;
We then left the connection open. The order matters: LISTEN committed before we started the transaction that we left pending.
There was no expensive processing or consumer performing calculations. During the experiment, pg_stat_activity showed exactly this state:
listener_informe|idle in transactionThe session was waiting for another command, but its transaction was still open.
Step 2: Fill the Notification Queue with pg_notify()#
In terminal B, open a second connection using the same command:
docker compose -p notify-sql-report exec postgres psql -X -U postgres -P pager=offYou can check the configuration and initial queue usage before sending messages:
SHOW server_version;
SHOW block_size;
SHOW max_notify_queue_pages;
SELECT pg_notification_queue_usage();
From the second session, we generated 100 sends to the demo channel. Each payload contained 7,000 x characters followed by a number. We included the send number in the output to identify which attempts succeeded:
\set ON_ERROR_STOP off
SELECT format(
    'SELECT %s AS send_number, pg_notify(%L, %L);',
    g, 'demo', repeat('x', 7000) || g
)
FROM generate_series(1, 100) g
\gexec
\gexec executed each generated statement separately. We kept psql in autocommit mode, so successful sends committed before the errors appeared. We also allowed the script to continue after each failure to complete all 100 attempts.
During the sends, this warning appeared:
WARNING: NOTIFY queue is 50% fullThe server's detail message identified process 516, the listener, as one of the processes holding the oldest transactions. The hint was specific: that transaction needed to end before cleanup could proceed.
Sends 1 through 64 succeeded. The remaining 36 failed with the same message:
ERROR: too many notifications in the NOTIFY queueMeasure Queue Usage with pg_notification_queue_usage()#
We then queried queue usage:
SELECT pg_notification_queue_usage();The result was 1, equivalent to 100%.
The function returns a fraction: 0 represents an empty queue, and 0.5 means 50%. If you prefer a percentage, use:
SELECT round(
    (100 * pg_notification_queue_usage())::numeric, 2
) AS queue_usage_percent;
The count of 64 messages reflects this run and the payload size we chose; it is not a general message capacity for LISTEN/NOTIFY. Pages also contain internal information, and their space does not correspond exactly to the sum of payload sizes.
What Appears in pg_notify/ When the Queue Is Full?#
With the queue saturated, we inspected its directory inside the container:
docker compose -p notify-sql-report exec postgres \
  sh -c 'ls -l "$PGDATA/pg_notify"'
We found these files:
| File | Observed size | | --- | ---: | | 000000000000000 | 262,144 bytes | | 000000000000001 | 139,264 bytes |
The visible file sizes did not add up to the configured 512 KiB, even though the queue usage function reported 100%. Adding up file sizes therefore does not replace that measurement.
The implementation describes a central queue shared by the databases in the instance, backed by pg_notify/ and managed through SLRU. This architecture combines pages in memory with disk storage; we are not measuring a RAM limit. The details are available in the PostgreSQL 17 source code.
Step 3: Restore Notification Delivery by Ending the Transaction#
We returned to the first session and ran:
COMMIT;The listener started displaying the pending notifications. Once it finished, we queried queue usage again from the second session. The result was 0.
We then sent a small message:
SELECT pg_notify('demo', 'vuelve a funcionar');The statement completed without an error. After running SELECT 1; in the listener, psql displayed the notification with the payload vuelve a funcionar—Spanish for “it works again.” This verified both sending and receiving after recovery. The payload shown here is the exact text used in the experiment.
| Stage | Measured queue usage | Result | | --- | ---: | --- | | Before sending | 0% | Empty queue | | After 100 attempts | 100% | 64 successful sends and 36 failures | | After the listener's COMMIT | 0% | Pending notifications delivered | | Verification send | Not measured again | Message sent and received |
What the PostgreSQL Queue-Full Error Demonstrates#
The observed sequence matches the documented behavior: a listening session with an open transaction can prevent queue cleanup. When the queue fills up, transactions executing NOTIFY fail at commit. The NOTIFY documentation explains both conditions.
This also highlights a consequence for applications: if a transaction combines database writes with a notification, a failure while committing the notification can prevent those writes from committing. This experiment only sent messages; it did not include a business table to measure that effect.
The test has a specific scope. We used one database, so we did not verify interference between different databases in the instance. We also did not reproduce PostgreSQL 16's historical wraparound calculation, fill 8 GiB, or measure latency or disk performance. Reducing the limit let us observe queue retention, saturation, and recovery.
What makes the experiment useful is how little it took to trigger the problem: a connected listener, an unfinished transaction, and a short sequence of messages. In this run, ending that transaction was enough to restore notification delivery without restarting PostgreSQL or changing the queue limit.
Frequently Asked Questions About the LISTEN/NOTIFY Queue#
Does PostgreSQL 17 Still Have an 8 GB Default Queue Limit?#
Yes. With 8,192-byte pages, the default max_notify_queue_pages value corresponds to 8 GiB. We configured 512 KiB for this experiment to reach the limit with few messages. The capacity chosen for the test should not be confused with the server's default setting.
Does Increasing max_notify_queue_pages Fix the Cause?#
It provides more space, but it does not end the transaction retaining the notifications. In our experiment, recovery happened when we ran COMMIT in the listener, without changing the capacity. This distinction helps separate giving the queue more room from addressing the reason messages are accumulating.
Do You Need to Restart PostgreSQL to Restore Notifications?#
We did not need to in this test. We ended the listener's transaction, confirmed that queue usage had dropped, and verified another send. In a real application, the decision to commit or roll back a transaction must account for the work that transaction is performing.
Clean Up the Lab#
Exit both psql connections with \q. Then remove the container and its test data:
docker compose -p notify-sql-report down -vThe experiment offers a practical observation: when notifications stop going through, measuring queue usage and checking open transactions helps explain what is happening. Two connections and a small queue were enough to show the complete sequence, from accumulating messages to restoring delivery.
Related investigations#
Connection pressure and transaction lifetime are different diagnostic questions. See PostgreSQL connection pool sizing for the former and incident metrics for choosing saturation signals. For expensive SQL, continue with query optimization.