

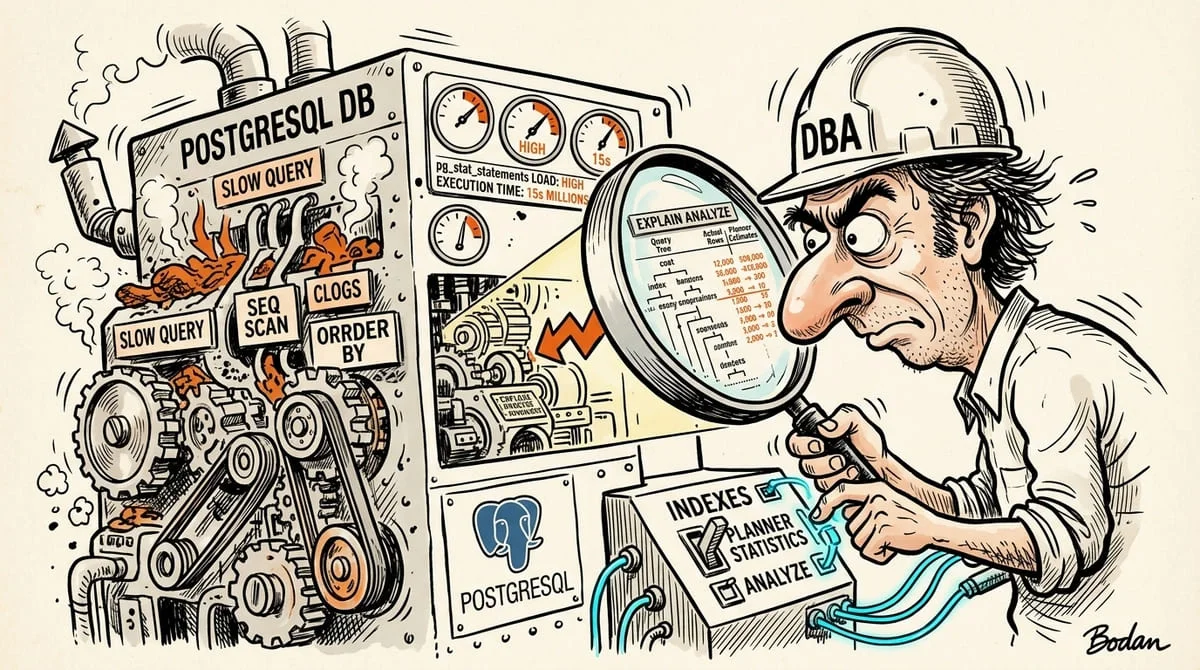
PostgreSQL Query Optimization: A Practical Guide to Slow Queries#
A PostgreSQL query can become slow without changing a single line of SQL.
Suppose an orders table has been growing for months. A query that used to respond quickly now takes around 15 seconds and starts triggering dashboard timeouts.
The scenario in this guide is hypothetical, but the diagnostic process, SQL, PostgreSQL tools and indexing techniques are real. The timings are illustrative and are used to make the optimization process easier to follow.
The obvious reaction would be to add an index.
That would start with the solution before understanding the problem.
The more useful question is:
What is PostgreSQL doing to execute this query, and why is it doing so much work?
A reliable optimization process follows that question:
identify → analyze → diagnose → optimize → verify.
How to Identify Slow Queries in PostgreSQL#
If you already know which query causes the problem, you can go directly to its execution plan.
In production, that is not always the case. You may know that an endpoint or dashboard is slow without knowing which SQL statement behind it is responsible.
Two PostgreSQL mechanisms are particularly useful here.
Find slow queries with PostgreSQL logs#
log_min_duration_statement can log completed statements that exceed a configured execution-time threshold.
For example:
log_min_duration_statement = 250msThe threshold itself is not a definition of a slow query.
A 300 ms reporting query executed occasionally may be perfectly acceptable. A 300 ms query executed hundreds of times per second can have a very different operational cost.
The log helps answer a concrete question:
Which individual executions are taking longer than expected?
Find expensive workloads with pg_stat_statements#
pg_stat_statements provides an aggregated view of SQL activity.
A query does not have to be the slowest individual statement to become expensive. If it runs often enough, a moderately slow query can consume more database time than a rare query with much higher latency.
A useful starting query is:
SELECT
    query,
    calls,
    total_exec_time,
    mean_exec_time,
    rows
FROM pg_stat_statements
ORDER BY total_exec_time DESC
LIMIT 20;
pg_stat_statements must be enabled before this view is available. It requires the module to be loaded by PostgreSQL and the extension to be created in the database.
Once the expensive SQL is identified, the next step is to inspect how PostgreSQL executes it.
How to Analyze PostgreSQL Query Performance with EXPLAIN ANALYZE#
Consider this query:
SELECT id, total, created_at
FROM orders
WHERE account_id = $1
ORDER BY created_at DESC
LIMIT 50;
At the SQL level, the intention is clear:
- filter by one account;
- return the newest rows first;
- stop after 50 results.
What the SQL does not tell us is how PostgreSQL finds those rows.
Run:
EXPLAIN (ANALYZE, BUFFERS)
SELECT id, total, created_at
FROM orders
WHERE account_id = 42
ORDER BY created_at DESC
LIMIT 50;
When testing manually, replace $1 with a representative value or analyze the corresponding prepared statement.
EXPLAIN shows the plan PostgreSQL chooses.
ANALYZE executes the statement and adds real timings and row counts.
BUFFERS helps show how much buffer activity was involved.
One operational detail matters:
EXPLAIN ANALYZE actually executes the statement.
With a normal SELECT, this is usually expected. With UPDATE, DELETE, INSERT, MERGE or another statement with side effects, those effects also occur unless the analysis is protected appropriately, for example inside a transaction that is rolled back.
How to Read a PostgreSQL Execution Plan#
You do not need to understand every planner node before an execution plan becomes useful.
Start with a few questions.
How many rows are processed?#
Imagine an execution plan containing something like:
Seq Scan on orders
Rows Removed by Filter: 999550
If PostgreSQL examines close to one million rows and returns only a few hundred, the interesting part is not the small result set.
It is the work needed to find it.
A large difference between rows processed and rows returned often deserves investigation.
Are estimated rows close to actual rows?#
PostgreSQL chooses execution strategies using estimates.
EXPLAIN ANALYZE lets you compare those estimates with what actually happened.
If the planner expects a few hundred rows but execution produces several thousand, that mismatch can influence decisions such as whether an index scan or a sequential scan appears cheaper.
The difference does not automatically tell you how to fix the query.
It tells you that the planner's model of the data may not match reality.
Is a Seq Scan necessarily bad?#
No.
A sequential scan can be the correct plan when PostgreSQL expects to read a large part of the table.
The interesting situation is a selective query that still causes PostgreSQL to inspect large amounts of unrelated data.
Consider this second hypothetical query:
SELECT DATE(created_at) AS day,
       COUNT(*) AS total_orders,
       SUM(total_amount) AS revenue
FROM orders
WHERE status = 'completed'
  AND region = 'EMEA'
GROUP BY day
ORDER BY day DESC;
Suppose the table contains 2.4 million rows and only has this index:
CREATE INDEX idx_created
ON orders(created_at);
The query filters by status and region, but the existing index only starts from created_at.
The database has an index.
It is simply not aligned with the access pattern of this query.
Case Study: From 15 Seconds to 8ms#
Return to the main query:
SELECT id, total, created_at
FROM orders
WHERE account_id = $1
ORDER BY created_at DESC
LIMIT 50;
Its access pattern gives us the index design:
- filter by
account_id; - read rows in
created_at DESCorder; - stop after 50 rows;
- return
id,totalandcreated_at.
A covering index for this query can be created as:
CREATE INDEX CONCURRENTLY idx_orders_account_date
ON orders (account_id, created_at DESC)
INCLUDE (id, total);
The structure is intentional.
account_id supports the equality condition:
WHERE account_id = $1created_at DESC follows the requested sort order:
ORDER BY created_at DESCid and total are required by the result but do not need to participate in index navigation, so they can be included as non-key columns.
This makes an Index Only Scan possible when PostgreSQL can satisfy the required visibility checks without repeatedly visiting the heap.
It does not guarantee that PostgreSQL will always choose an Index Only Scan.
In our hypothetical execution, suppose the original plan took approximately 15 seconds and the optimized plan completed in around 8 ms.
The number is illustrative.
The important part is why the performance changed.
PostgreSQL did not become dramatically faster at doing the same work.
The new access path allowed it to avoid most of that work.
PostgreSQL Index Optimization: Design Around the Query#
The second example follows the same principle.
The query is:
SELECT DATE(created_at) AS day,
       COUNT(*) AS total_orders,
       SUM(total_amount) AS revenue
FROM orders
WHERE status = 'completed'
  AND region = 'EMEA'
GROUP BY day
ORDER BY day DESC;
A more appropriate index for this access pattern could be:
CREATE INDEX idx_orders_region_status_created
ON orders(region, status, created_at)
INCLUDE (total_amount);
followed by:
ANALYZE orders;Here:
regionandstatussupport the equality filters;created_atremains part of the indexed access path;total_amountis stored because the aggregation needs it.
That structure makes an index-only strategy possible when PostgreSQL determines it is appropriate.
Again, the lesson is not to copy this index into another database.
The useful process is to work backwards from the query.
Before creating an index, ask:
- Which columns reduce the search space?
- Which columns determine ordering?
- Which columns are needed in the result?
- How many rows normally match?
- Does the current index reflect that access pattern?
An index should solve a workload.
It should not exist only because a column looks important.
Why PostgreSQL Is Not Using Your Index#
The existence of an index does not force PostgreSQL to use it.
The planner compares alternative plans and chooses the one it estimates will be cheaper.
Statistics are part of that decision.
ANALYZE updates information about the contents and distribution of table data:
ANALYZE orders;This command does not make a query faster by itself.
It improves the information available to the planner.
If PostgreSQL ignores an index that looks relevant, compare:
estimated rows
vs.
actual rows
before assuming the planner is wrong.
A poor estimate can make a sequential scan appear cheaper than an index-based strategy.
The underlying problem may be the index, the statistics, the distribution of the data or a combination of them.
When Query Rewriting Matters#
Indexes cannot solve every performance problem.
The SQL itself may also need attention.
Functions or expressions applied to indexed columns can change whether an existing index is useful for a particular predicate.
If the expression itself is part of the real access pattern, an expression index may be appropriate.
Pagination is another common example.
Repeatedly increasing OFFSET can require PostgreSQL to work through rows that the application no longer needs.
When the application model allows it, keyset pagination can continue from the last value already seen rather than repeatedly skipping an increasing number of rows.
The wider point is that query performance comes from the interaction between:
SQL
+ data distribution
+ indexes
+ planner statistics
+ execution plan
Optimizing only one of those pieces can leave the real bottleneck untouched.
PostgreSQL Tools for Query Performance Analysis#
The core PostgreSQL tools answer different questions.
Slow query logs help identify individual executions that exceed a relevant duration.
pg_stat_statements helps identify expensive SQL patterns across repeated executions.
EXPLAIN shows the plan PostgreSQL intends to use.
EXPLAIN ANALYZE adds actual execution data.
BUFFERS helps show how much buffer activity was associated with the plan.
They are not competing tools.
They work best as stages of the same investigation:
Find
↓
Analyze
↓
Diagnose
↓
Optimize
↓
Verify
When an Index Does Not Solve the Performance Problem#
Indexes are not free.
They use storage and have to be maintained when rows are inserted, updated or deleted.
A composite index that improves a critical read path can be a good trade-off.
Creating an index for every possible filter combination usually is not.
There is also a more fundamental limit.
Suppose a query genuinely needs to aggregate millions of matching rows.
An index can improve how those rows are found, but it does not remove the cost of processing millions of rows.
At that point, the bottleneck may move from data access to aggregation.
Depending on the workload, techniques such as materialized views or precomputed summaries may become more appropriate.
An optimization can move the bottleneck.
That is why the new execution plan matters more than the simple existence of a new index.
PostgreSQL Query Performance Checklist#
When a query becomes slow, use a repeatable process:
- Identify the expensive SQL. Use logs or workload statistics instead of intuition.
- Capture the execution plan. Run
EXPLAIN (ANALYZE, BUFFERS)when executing the statement is safe. - Compare rows processed with rows returned.
- Compare estimated rows with actual rows.
- Understand the access method. Ask why PostgreSQL chose a sequential scan, index scan or index-only scan.
- Compare indexes with the actual access pattern.
- Review planner statistics.
- Review the SQL itself.
- Measure again after the change.
- Evaluate the trade-off.
The workflow is more reusable than any individual optimization trick.
Conclusion#
PostgreSQL query optimization is mostly about understanding work.
A slow query tells us that the database is spending time somewhere in the execution path. Logs and pg_stat_statements help identify where to investigate. EXPLAIN ANALYZE shows what PostgreSQL actually did. Row counts, estimates, scan types and buffer activity help explain why.
In our hypothetical case, the query drops from roughly 15 seconds to around 8 milliseconds because the new index matches how the query filters, orders and retrieves its data.
The exact timing is not the lesson.
The lesson is that the database no longer needs to perform the same amount of unnecessary work.
The useful sequence is:
measure → understand → change → measure again.
An index may be the result of that process.
It should not be the starting assumption.